
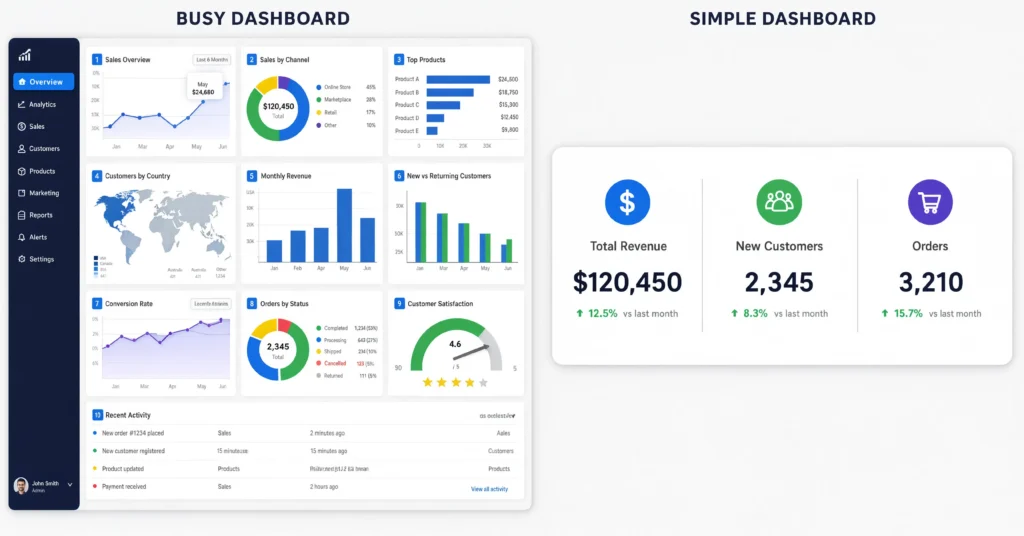
Most course dashboards are full of numbers. Views, logins, time on page, completion percentage. Not all of them tell you anything useful. Some just make a report look busy.
This post covers how to measure learner engagement in a way that actually predicts whether people are learning, not just clicking. We will cover the numbers worth tracking, the ones worth ignoring, and how to set up your reporting so you are not drowning in charts that do not help you decide anything. None of this requires expensive software. Most of it just requires looking at the right number instead of the easiest one to find.
Why Most Teams Track the Wrong Numbers
It is easy to open a dashboard and see a big number that looks good. Ten thousand views. Ninety percent logged in this month. These numbers feel like progress, but they rarely tell you if anyone actually learned something or changed how they work.
Good learner engagement metrics answer a different question. Not “did people show up,” but “did people get better at the thing we were trying to teach them.” That shift changes which numbers deserve your attention.
The Learner Engagement Metrics That Actually Matter
1. Completion Rate, by Lesson, Not Just by Course
A single completion percentage for a whole course hides where people actually quit. Break it down lesson by lesson instead. If everyone finishes the first three lessons but half quit on lesson four, that lesson has a specific problem worth fixing.
Example: A team saw an overall completion rate of 70 percent and assumed the course was mostly fine. Once they broke it down by lesson, they found lesson four alone had a 45 percent drop off. Fixing just that one lesson brought overall completion up to 88 percent.
2. Drop Off Point
This is the exact spot in a lesson where people stop. It usually points to something specific, like a lesson that runs too long, a confusing instruction, or a question that trips people up for the wrong reason. Drop off point is one of the most useful learning performance metrics you can track, since it tells you exactly where to look, not just that something is wrong somewhere.
3. Quiz and Assessment Scores
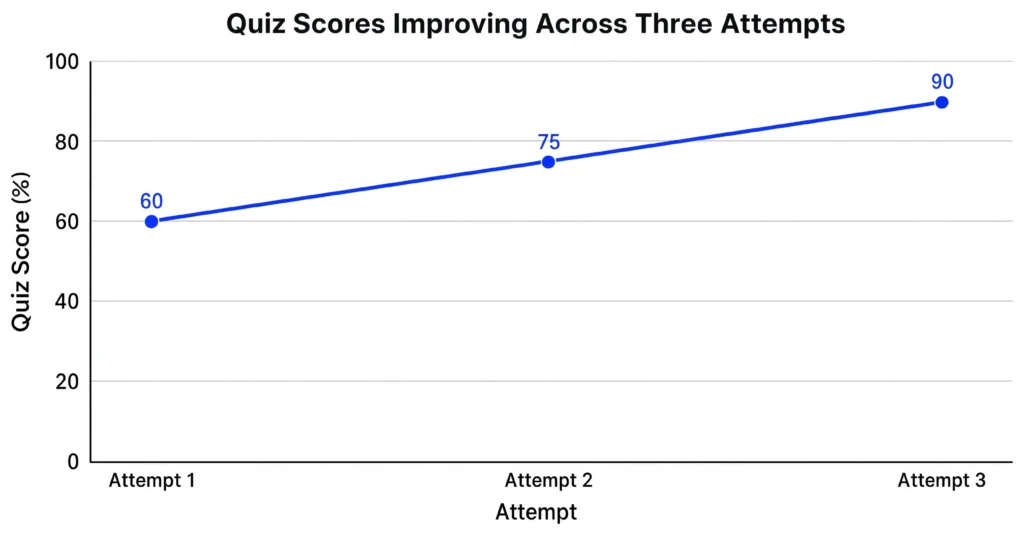
Views and clicks tell you someone opened a lesson. A quiz score tells you whether they actually understood it. Track scores over time, not just a single pass or fail. A group that slowly improves quiz scores across several attempts is learning. A group that gets the same low score every time is not.
Watch for a specific pattern here. If most people pass on the first try with a high score, the quiz may be too easy to tell you anything useful. If most people need three or four attempts to pass, the actual lesson content probably needs to be clearer, not the quiz itself.
4. Time Spent vs Expected Time
If a five minute lesson takes people twenty minutes on average, something is unclear and people are struggling. If it takes people ninety seconds, they are probably skipping through without reading. Either extreme is worth a closer look, not just the average number on its own.
5. Return and Repeat Visits
Do people come back to review a lesson later, on their own, without being told to? This is a strong signal that the content is actually useful to them in their day to day work, not just something they sat through once and forgot.
6. On the Job Application
This is harder to measure but more important than almost anything else on this list. Did the training actually change what someone does at work? A manager noticing fewer mistakes, faster task completion, or better customer interactions is a much stronger signal than any click inside the course itself.
A simple way to check this without a big system is a short manager check in a few weeks after training. Ask one direct question, like whether they have noticed a specific behavior change on the job. A handful of honest answers from managers often tells you more than a month of dashboard data.
For teams building this into a broader plan, our guide to the future of e-learning covers how measurement fits alongside other shifts, like AI tools and shorter lessons.
Vanity Metrics to Stop Obsessing Over
Total views and logins look impressive in a slide deck, but they do not tell you if anyone learned anything. Someone can open a lesson and immediately close it again, and that still counts as a view.
Average time on platform, on its own, is nearly meaningless too. Someone could be genuinely engaged, or they could have left a tab open while doing something else entirely. Without pairing it against a specific lesson and an expected time, this number tells you very little.
Certificate counts are useful for compliance records, but a certificate does not prove someone actually retained anything. Plenty of people pass a final quiz through guessing or repeated attempts, then forget the content within a week.
Number of logins is another common vanity metric. Someone can log in daily out of habit or because a notification nagged them, without ever engaging with new content. Pair login counts with an actual activity metric, like a lesson completed or a quiz attempted, before treating a login as a sign of real engagement.
Setting Up LMS Reporting the Right Way
Most learning platforms already collect far more learning data analytics than teams actually use. The problem is usually not a lack of data. It is too many charts and not enough focus on the few numbers that matter.
Start by picking three to five learner engagement metrics that map directly to your actual goals, not everything the dashboard offers by default. If your goal is fewer mistakes on a task, track quiz scores and on the job application. If your goal is habit building, track return visits and completion by lesson. Our post on gamification techniques that improve completion rates covers a related angle, using these same metrics to check whether a game element is actually helping or just adding noise.
Good LMS reporting should answer one clear question every time you open it. Is this course working, and if not, exactly where is it breaking down. If your current reports cannot answer that in under a minute, they need to be simplified, not expanded.
Student engagement analytics work the same way in a classroom setting. The specific numbers change slightly, but the goal stays the same. Find the exact point where people struggle, and fix that point specifically instead of redesigning the whole course. This matters just as much on mobile-first course design, where mobile drop off points often show up in different spots than desktop ones.
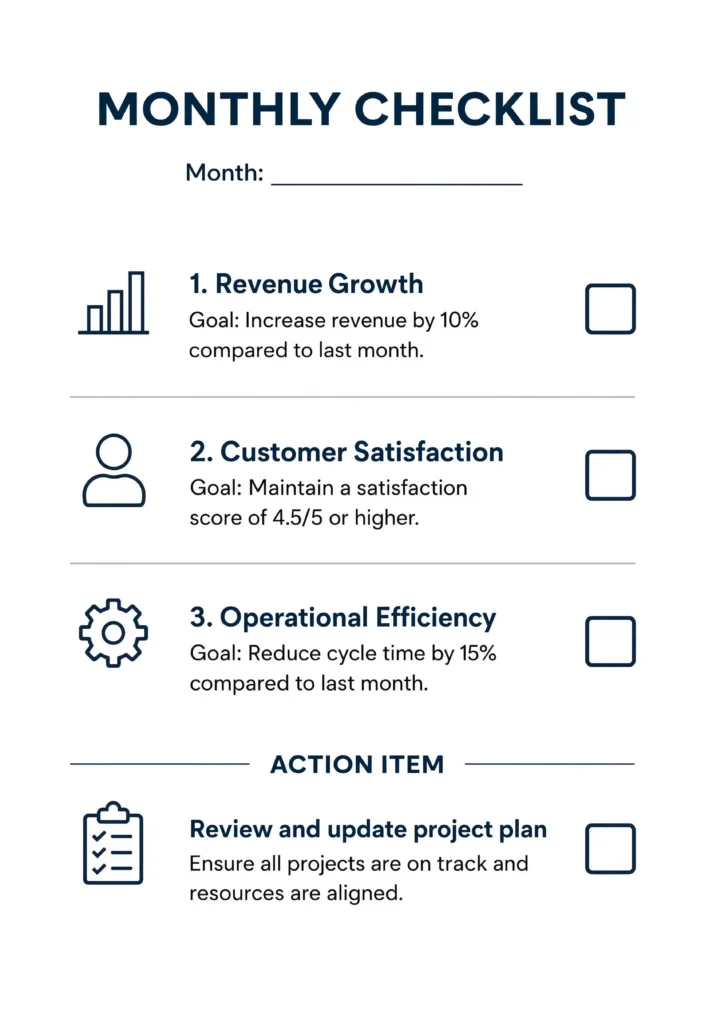
A simple monthly routine helps here. Once a month, pull your top three metrics, compare them to last month, and write down one specific action based on what changed. This turns reporting into a habit that actually leads to fixes, instead of a report that gets glanced at and forgotten.
Employee Training KPIs Leadership Actually Cares About
Leaders outside the training team usually do not want to see every metric above. They want a short answer to a bigger question. Is this training worth the money and time we are spending on it.
A useful way to answer that is borrowing from a well known framework for evaluating training. The Kirkpatrick Model breaks evaluation into four levels, starting with how people reacted to training, then what they learned, then what changed in their actual behavior, and finally what changed for the business. Most teams only ever report the first level, a simple satisfaction score, which tells leadership almost nothing about real impact. Real training effectiveness metrics live in the later levels, not the first one.
A stronger set of employee training KPIs pulls from higher levels of that model. Completion and quiz scores cover the early levels. Manager observed behavior change and business numbers, like fewer errors or faster task times, cover the levels that leadership actually cares about.
A Note on Learning Analytics Standards
If you are comparing platforms or building custom reporting, it helps to know that most modern systems can track detailed learner activity using a shared, standard format. This makes it possible to pull consistent learning analytics across different tools instead of being stuck with whatever one platform happens to show you by default.
Frequently Asked Questions
Q: What is the single most important learner engagement metric?
A: If you can only track one, track completion by lesson, not by course. It shows you exactly where people are dropping off, which is the fastest way to find what needs fixing.
Q: How often should I check eLearning metrics?
A: Weekly is usually enough for an active course. Checking daily often leads to reacting to normal day to day noise instead of real patterns.
Q: Do these metrics work the same way for compliance training?
A: Mostly yes, but completion still matters more for legal reasons in compliance training. Pair completion with quiz scores so you know people are not just clicking through to check a box.
Q: What is a good baseline completion rate to aim for?
A: This varies a lot by course length and audience, so compare your own course over time rather than chasing an industry number. A steady improvement in your own data matters more than matching someone else’s average.
Q: Should small teams bother with detailed tracking and reporting?
A: Yes, but keep it simple. Even a basic spreadsheet tracking completion by lesson and quiz scores over time gives a small team most of the value a bigger analytics setup would, without the extra cost or complexity.
Final Thoughts
Good learner engagement metrics point at one thing. Whether people are actually learning and using what they learned, not just whether they showed up. Completion by lesson, drop off point, and quiz scores over time will tell you far more than a big total view count ever will. Pick a handful of numbers that map to your real goal, check them regularly, and be willing to fix a specific lesson instead of redesigning an entire course every time something looks off. Small, targeted fixes based on real data almost always beat a big redesign based on a guess.